A lot of high quality information has been put out (that I have personally benefited a lot from) about ‘Network effects’ – ranging from the ‘what’, the ‘how’, the ‘what kind’ and the tremendous value they end up creating for companies that benefit from them. Having said that, I have personally struggled to build a simple framework to establish the presence of (and measure) network effects. The idea of this blog is to answer the following questions (1) Does the business have network effects? – idea is to have some mathematical measure & some judgment to decide (2) How strong is the network effect ? – while the network effect might create tremendous value for your customers but the real measure of the network strength is based on how much of the value created can be retained by the business. I define this value retention for the business in terms of ‘Pricing Power’ (3) Implications on business model and strategy
It is timely to go back to the definition of Network effects – the value of the service/product increases with more usage. Essentially, ‘usage’ favorably impacts the four key tenets of value proposition what I sometime refer to as the Better, Cheaper, Faster and Reliable (‘BCFR’ framework and more on this in a separate blog coming soon)
The two key metrics that I believe help establish the presence (help measure) network effects include the following –
(1) Shape & Growth of Conversion (%)
(2) Demand Side and Supply Side Cohorts
Let’s jump right in.
Shape & Growth of the Conversion (%) graph –
The following graphs plots, for three internet companies with marketplace business models, the Conversion (%) (total transacting users as a % of total unique traffic) Vs. Density of Suppliers on the platform for a particular ‘geographical radius’ (wherein buyers and suppliers can complete a transaction) For example, the ‘geographical radius’ for a food delivery company would be a 3-5 Km radius around the restaurant.
Graph 1 – Conversion (%) for a leading consumer internet marketplace company

Graph 2 – Conversion (%) for a publicly listed marketplace company

Graph 3 – Conversion (%) for a leading consumer internet company with a marketplace business model
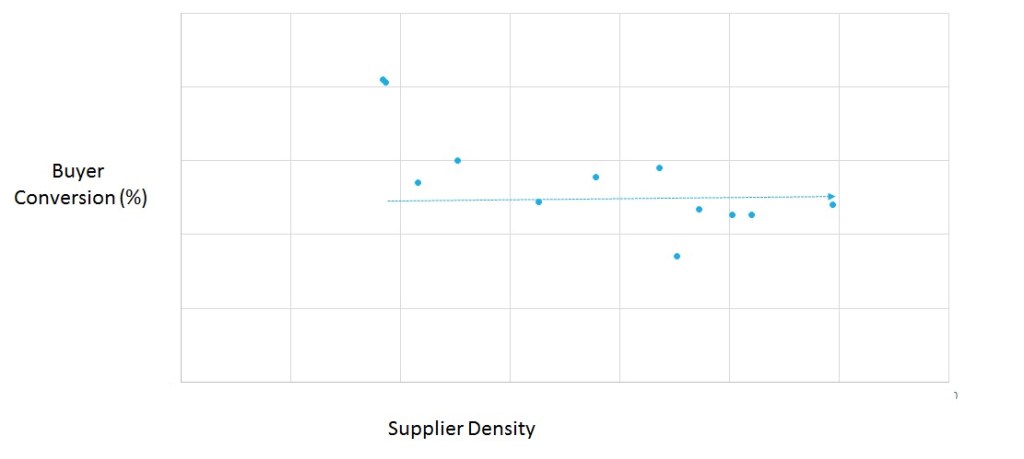
It is self-explanatory that companies depicted Graphs 1 &2 exhibit network effects while that in Graph 3, even though it employs a marketplace business model has no network effects. Nothing wrong with not having ‘network effects’ (very few companies have network effects and a fewer share of those have strong network effects) it just that you need to find another form of economic moat (more on that below).
I have talked about the importance of conversion (%) here – https://thenetwortheffect.com/2018/02/19/measuring-product-market-fit-is-your-startup-curwing-in-the-right-direction/ AND https://thenetwortheffect.com/2017/07/04/3-cs-of-profitable-growth-key-metrics-to-kill-for-or-else-get-killed/–
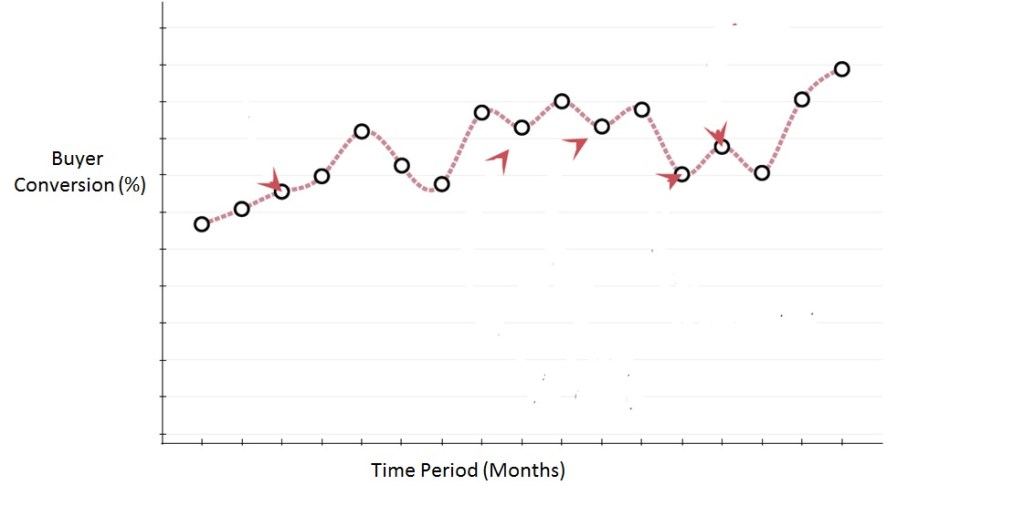
Conversion (%) and the conversion (%) trend is to me arguably the most important metric to measure the health of an internet business (I have not found a truly valuable business wherein conversion (%) is going down!) and also, incredibly hard to improve (discounts don’t count :)). And hence, there will be other valuable companies with an increasing conversion (%) – having said that, unlikely the shape of the graph will be such ( rapid upward movement with increasing supplier density) and also, the reason for conversion (%) increase would not be increasing supplier density. The following chart is the conversion (%) chart, over time (months), for a very valuable software company that was able to increase conversion (%) on the back of product and sales model changes –
Graph 4 – Conversion (%) for a leading software company
Demand Side and Supply Side Cohorts
As per the definition of network effects, the product/service becomes more valuable with more usage, and hence, market participant (buyer/seller) retention and usage should increase over time. You should see graphs looking like the following –
Customer Retention Graph – Every new cohort performing better than the previous one as the network becomes more valuable with increased usage.

Businesses that have low repeat frequency or a large time gap between consecutive transactions should measure supply retention and usage cohorts. For example, supplier head count retention or number of hours devoted per supplier per week. Rapid growth in these metrics will point towards the existence of a network effect.
In order to establish the presence network effects, you will need to prove both ‘Shape & growth of the Conversion (%)’ and ‘Improving market participant retention’. I have witnessed the painful journey wherein, both the founders & board members, believed but never mathematically tested, if the business had network effects. The company chased marketplace liquidity through its strategy, investments and products, which then never really fructified. In the process, the company compromised its real economic moat which was building a consumer brand. The Result – painful pivot!
Strength of the Network Effect
It is no secret that NOT all network effects are equally powerful. And hence, it is important to understand the factors driving network strength. And also, understand the potential impact on business model and strategy.
The real test of the strength of a network effect (or for that matter of any economic moat) from a business perspective is ‘Pricing Power’ – in other words, the strongest network effects, while providing better supplier/buyer experience, drive pricing power for the business. The reason I underline ‘business perspective’ is that it is often assumed that value created by network effects will also be captured by the business – there are businesses with network effects which create tremendous customer value but competition reduces (or fully eliminates) their ability to retain any value. And hence from a business perspective, I term such network effects as ‘weak’ network effects.
For example, the company depicted in Chart 2, has strong network effects as the company has been able to increase pricing 12% CAGR over the last 3 years while nearly doubling EBITDA margin (%) (Source – company annual report)
‘Pricing power’ of a network business is a function of two key important aspects –
- Extent to which market participant (buyer/seller) ‘reputation’ is exclusive to the platform – best understood through an example, a supplier on AirBnB or any open B2B marketplace has her reputation pretty much exclusive to the platform in the form of reviews and ratings by users or stamp of authenticity provided by the platform in the case of a supplier of a B2B marketplace. It is extremely difficult for the supplier to rebuild this reputation outside the platform. On the contrary, the reputation of a doctor is built through ‘word of mouth’ and exists independent of the platform in the local market and the ‘reputation’ of a commodity service like cab hailing doesn’t really matter (I have not waited or cancelled an existing driver allocation for a higher rated driver)
- Buyer preference to using a specific supplier – self-explanatory but if the buyer is sensitive to using the same supplier then there is a serious risk of disinter-mediation. This is further exacerbated if the buyer and supplier have the ability to exchange information outside the platform, the platform has high transaction cost and the friction in direct transaction is low.
The following matrix attempts to classify strength of network effects based on the above mentioned parameters –

Quad 1 – “Strong Pricing Power and Ad driven business model” – classic example is an open B2B marketplace wherein suppliers and buyers discover each other based on the supplier authentication (reputation exclusive to the platform) completed by the platform. The supplier reputation, valuable for the buyer to evaluate a transaction, locked into the platform, provides the platform for strong pricing power (Better ratings – – >better ranking – – >better discovery – – >more business and hence, the supplier should be ready to part with more!). While ‘Pricing power’ is strong, the ease with which the market participants can dis-intermediate the platform results in challenges in developing a transaction marketplace business model. And hence, the most successful and prevalent business model is ad$ driven.
Key Takeaways –
- Strategy – the platform need to continue to deepen the ‘reputation’ value as it facilitates buyer decision making and keeps competition at bay. Opportunity to build a very capital efficient and ‘winner takes most’ business.
- Business Model – As mentioned above, companies in this quadrant find it hard to build transaction business models. And hence, the market opportunity is reduced to supplier ad spends vis a vis a share of the supplier top line. (One of the key reasons you see more ‘multi category’/’horizontal’ players rather than ‘single category’/‘vertical’ players in this category is the total market opportunity is limited in the case of ‘vertical’ ad spends)
Quad 2 – “Strong Pricing Power and Transaction driven business model” – I call this the ‘sweet spot’ wherein the platform locks in supplier/buyer reputation while enabling a transaction marketplace as buyers are indifferent or in some cases want new suppliers. These are typically businesses that bring ‘new’ type of supply/buyer to the market and hence, are able to lock in supplier/buyer reputation early on. TRULY VALUABLE!
Key Takeaways –
- Strategy – Rapid scale up with a dogged focus on locking in supplier/buyer reputation. In some cases, I have witnessed entrepreneurs not focusing on building supplier/buyer platform reputation but chasing market liquidity through scale – while scale is important but not locking in buyer/seller ‘reputation’ is a cardinal sin.
- Business Model – lends very well to transaction business models.
- If your business lies in this quadrant or has the potential to be in this quadrant please give me a shout.
Quad 3 – “Weak Network Effects and Transaction driven business model” – these businesses create a lot of value for users but are not able to retain any of that because of competition (read ‘hyper competition’) as platform reputation is not relevant and scale is the only lever driving long term moat. This often drives the worst form of competitive behavior as companies spend relentlessly to acquire market share resulting in overall capital efficiency going for a complete toss. Not to forget that this often drives well funded entrepreneurs to chase completely different businesses in the name of scale/liquidity. Finally, it doesn’t take a lot in terms of number of players to create such a situation – in most cases, you need only one more, well-funded, player in the market to spoil your happiness with regards to capital efficiency.
Key Takeaways –
- Strategy – consolidate the market to build ‘pricing power’ and drive ‘capital efficiency’ before it’s too late – market saturation hits or you run out of capital as investors start to look at numbers below the headline growth numbers.
- Business Model – lends very well to a transaction marketplace business model.
Quad 4 – “Little or No Network Effects” – shape of conversion (%) graph will NOT resemble a smooth upward trend increase nor cohorts will not improve as a function of increased supplier density. Both these metrics might still improve but not for reasons that lend to a marketplace business model.
Key Takeaways –
- Strategy – develop business value chain to build a consumer brand or chase low relative cost strategic position by exploiting economies of scale.
To Summarize –
- Measure/detect real ‘Network Effects’ on the basis shape and growth of conversion (%) and retention cohorts
- Not all network effects are equally powerful – the real test of network effect strength is the ‘Pricing Power’ it provides to the business.
- Build Supply/Buyer Lock-in by developing ‘platform’ exclusive reputation (do give me a shout if you can do this) and then scale up fast to drive marketplace liquidity. Golden opportunity to build a ‘winner takes most’ business.
- Choose the right business model based on ‘Buyer-Supplier’ preference and ability to dis intermediate the platform. Avoid wishful thinking – if the can, they will dis-intermediate!
- Everything Starts from Nothing!

Love the article! Any chance we can have a conversation about it?
LikeLike